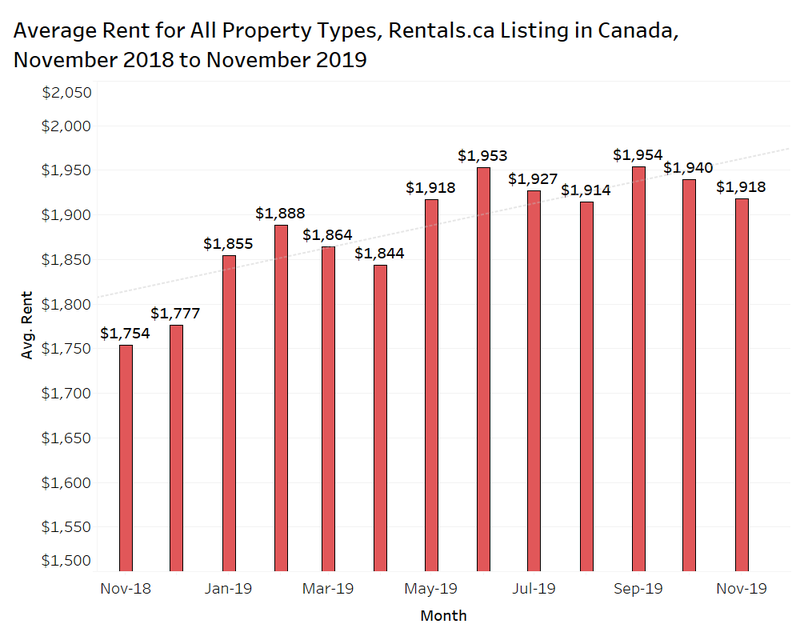
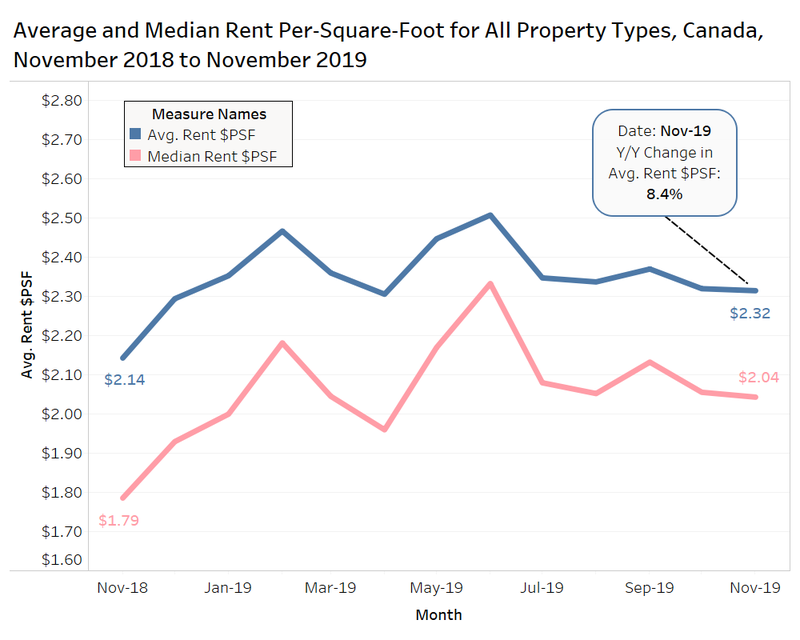
When comparing the change in rent monthly, quarterly or annually, it is important to understand if the composition of the sample of transactions is changing. A way to look at rent that controls for changes in the size of properties is to look at the rent per-square-foot (psf).
The average rent per-square-foot nationally for all property types has increased by 8.4% annually from $2.14 psf in November 2018 to $2.32 psf. However, the average rent per-square-foot has been fairly flat since July.
It must be kept in mind, landlords and property owners do not list (or know) the unit size for every property on Rentals.ca, and these figures represent a smaller sample size in comparison to the total listings, which is more heavily weighted with Ontario and British Columbia urban markets, where every square foot counts, and there are more new units where the unit size is known.
To add another caveat, landlords with very small units may not list the unit size even though they know it, because they it might prevent prospective tenants from calling or viewing the suite. This is important because the smallest units typically have the highest rent per-square-foot outside of penthouses and units with expansive balconies.
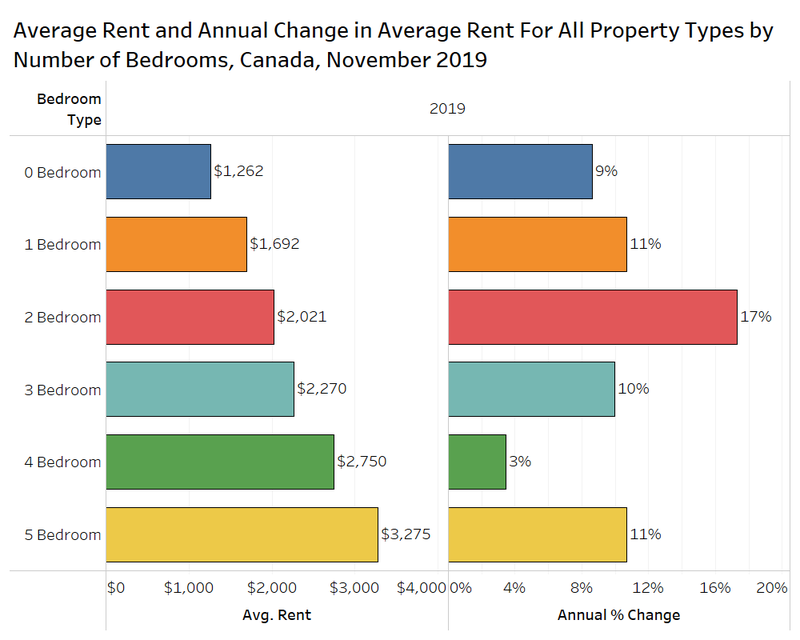
The 8%-9% rent increase over the past year is not consistent across built forms and bedroom types. The chart below looks at the average rent by bedroom type for all properties listed on Rentals.ca in November. The data shows two-bedroom units have experienced the highest annual growth at 17%, followed by one-bedroom and five-bedroom units at 11%, and three-bedroom units at 10%.
According to survey data from Statistics Canada, 27% of people who moved over the past five years did so to move to a larger or more high-quality dwelling. Tenants want more space, and two bedrooms have always been a very desirable suite among renters. In November, two-bedroom units made up 37.9% of listings on Rentals.ca, just edging out one-bedroom units at 37.8%.
Across the country, two-bedroom units from 900 sf to 1,100 sf have been popular and experiencing strong rent growth nationally.
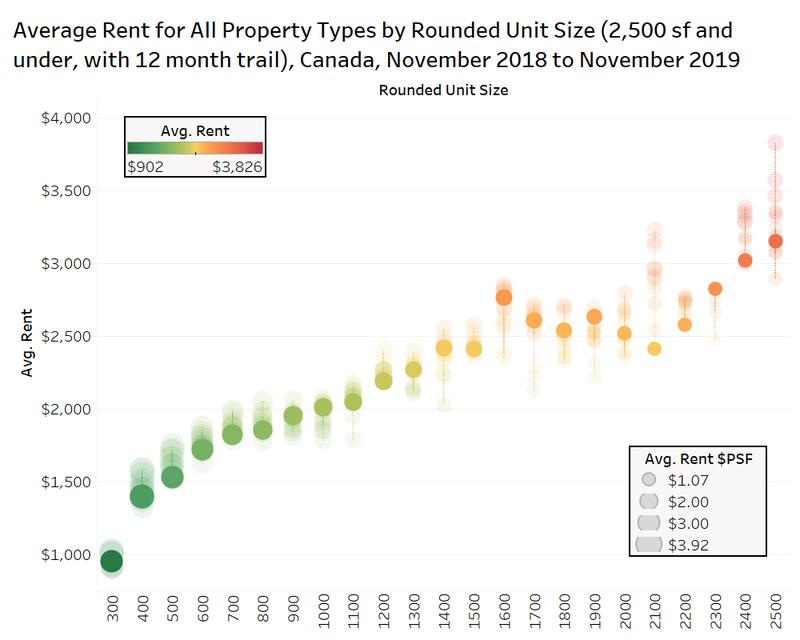
The chart below looks at the average rent by rounded unit size for all property types in Canada in November 2019, with the last 12 monthly readings shown via the faded markers (square footage is rounded to the nearest hundredth).
The highest annual appreciation in rents is occurring for units from 1,600 sf to 1,900 sf, with the higher point in that range being units rounded to 1,900 sf, which are up 19% annually. The second grouping experiencing the high growth is units from 900 sf to 1,100 sf, which are up between 8% and 15%. The slowest annual growth is occurring in the 2,000 sf to 2,200 sf range (the sample size is small) and in the 1,200 sf to 1,500 sf range.
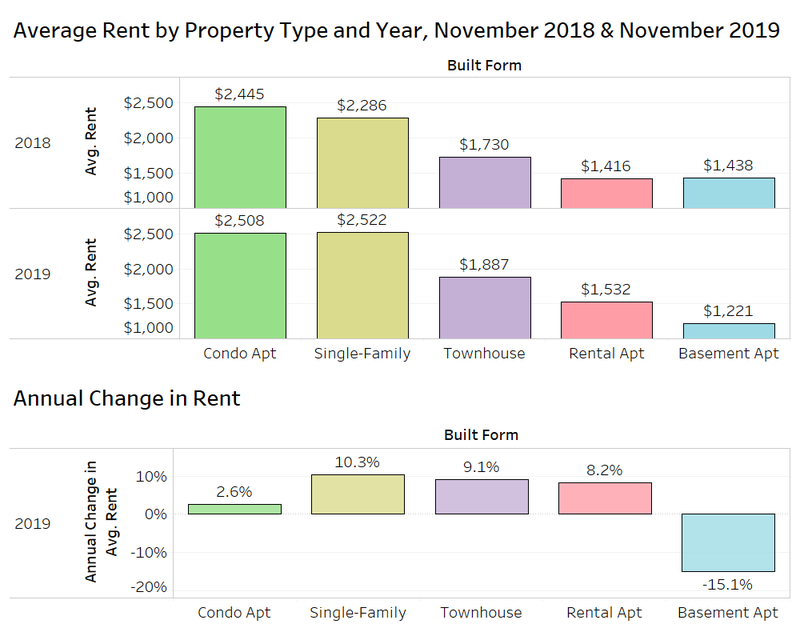
Single-family homes (single-detached and semi-detached) experienced the highest annual price growth among property types in Canada at 10.3%, rising from $2,286 per month in November 2018 to $2,522 per month in November 2019.
Townhouses increased by 9.1% annually, rental apartments grew by 8.2% annually, while condominium apartments lagged with growth of just 2.6%. Basement apartments declined year-over-year, but the sample size is small, and the results are not likely an indication of a big drop in demand for this property type.
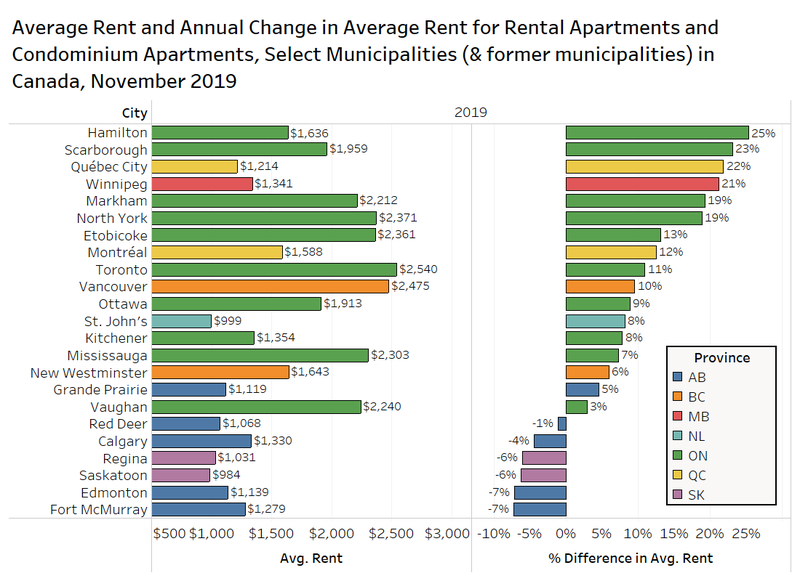
The majority of listings on Rentals.ca are rental and condominium apartments, and the chart below looks at the average rent and the annual change in average rent for a select number of Canadian municipalities (and former municipalities prior to amalgamation) in November 2019.
As was the case in October, Hamilton and Scarborough led the pack with year-over-year rent growth of 25% and 23%, respectively for apartments with rental or condo tenure.
Two of the more affordable Canadian rental markets, Quebec City and Winnipeg, have both experienced a significant jump in rent year-over-year, increasing by 22% and 21%, respectively.
On the other extreme are the municipalities in Alberta and Saskatchewan, with Red Deer, Calgary, Regina, Saskatoon, Edmonton and Fort McMurray all seeing average rents for apartments decline from November 2018 to November 2019. The declines range from 1% to 7% annually.
Vancouver
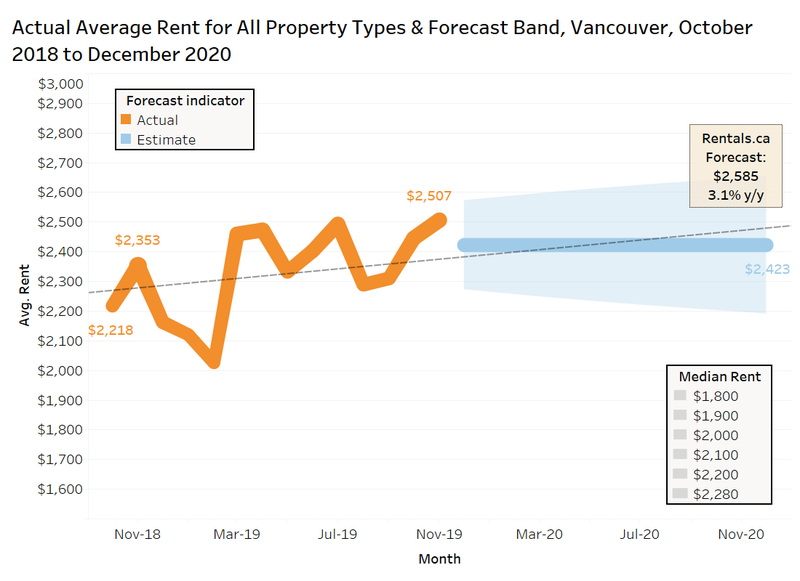
The chart below looks at the average rent for all property types in Vancouver from October 2018 to November 2019, and the Rentals.ca and Bullpen Consulting forecast for 2020.
In November of 2018, the average rental rate was $2,353 for all property types listed on Rentals.ca. That rate increased to $2,507 for November 2019, an increase of 6.5% annually. Overall in 2019, the average rent in Vancouver was $2,351 per month (through 11 months).
The forecast calls for average rent in 2020 overall to be $2,423, with December 2020 rent at $2,585 per month, a 3% annual increase (3.1% from November 2019). This forecast is a moderation from the 7% annual growth forecasted by Rentals.ca and Bullpen last year.
New rental apartment completions are expected to rise in Vancouver in 2020, coupled with relatively flat resale market conditions, should result in less rent inflation.
Calgary
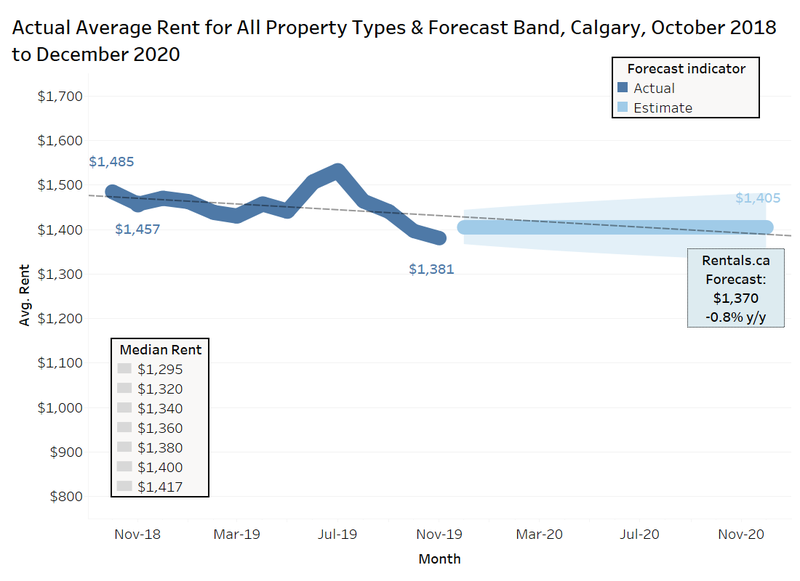
The chart below looks at the average rent for all property types in Calgary from October 2018 to November 2019, and the Rentals.ca and Bullpen Consulting forecast for 2020.
In November of 2018, the average rental rate was $1,457 for all property types listed on Rentals.ca, that rate decreased to $1,381 by November 2019, a decrease of 5.2% year-over-year. Overall in 2019, the average rent in Calgary was $1,450 per month.
The forecast calls for average rent in 2020 overall to be $1,405, with December 2020 rent at $1,370 per month, a 1% annual decline. This forecast is a moderation from the 4% annual growth forecasted by Rentals.ca and Bullpen last year, which clearly put excess weight on some of the positive economic data at this time last year.
A continued slump in the energy sector should continue to keep rents flat in 2020.
Edmonton
The chart below looks at the average rent for all property types in Edmonton from October 2018 to November 2019, and the Rentals.ca and Bullpen Consulting forecast for 2020.
The average rental rate was $1,223 for all property types listed on Rentals.ca in November 2018, that rate decreased to $1,175 for November 2019, a drop of 3.9% annually. Overall in 2019, the average rent in Edmonton was $1,257 per month.
The forecast calls for average rent in 2020 overall to be $1,207 for all property types, with December 2020 rent at $1,165 per month, a 1% annual decline. This forecast is similar to the zero growth forecasted for Edmonton by Rentals.ca and Bullpen in 2018. The forecast of 0% rent change was on track in the first half over the year, but rents slumped in the second half of 2019. Like Calgary, the continued uncertainties in oil-related industries should continue to keep rents flat in 2020.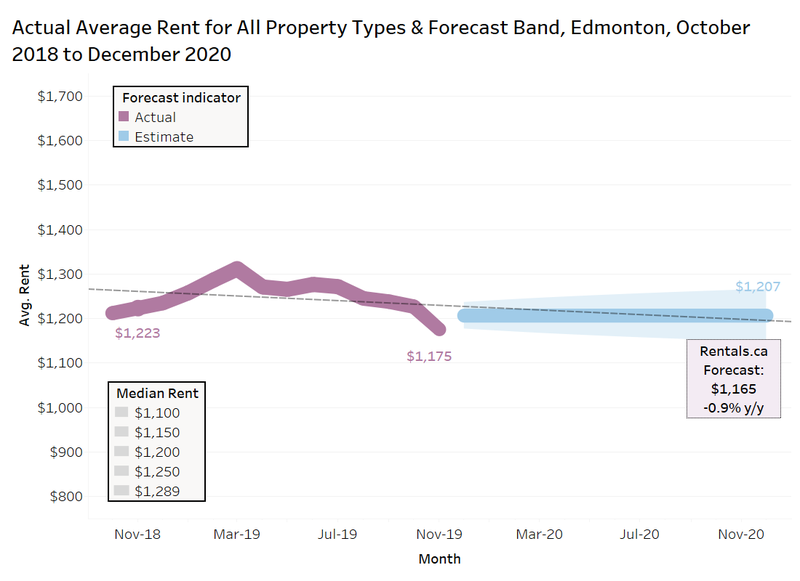
Toronto
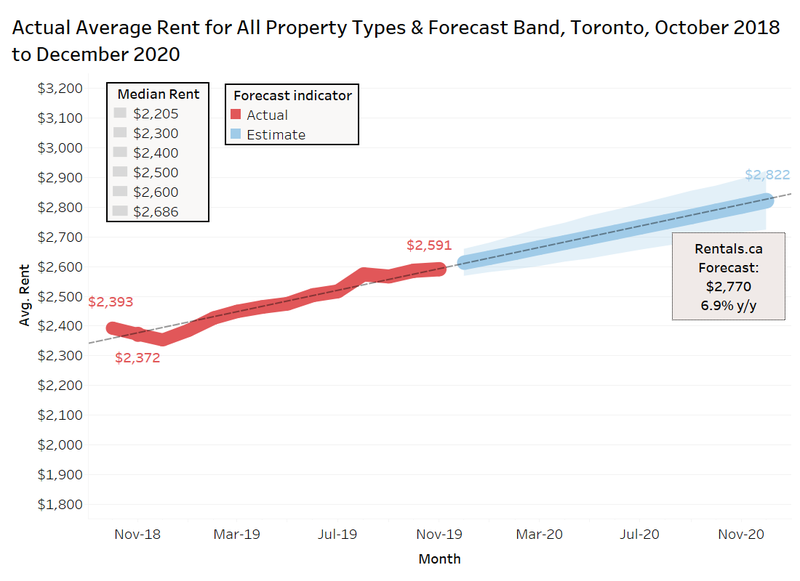
The chart below looks at the average rent for all property types in the former City of Toronto (pre-amalgamation) from October 2018 to November 2019, and the Rentals.ca and Bullpen Consulting forecast for 2020.
In November of 2018, the average rental rate was $2,385 for all property types listed on Rentals.ca, that rate increased to $2,591 for November 2019, an increase of 8.6% annually. Overall in 2019, the average rent in Toronto was $2,504 per month.
The linear forecast calls for average rent in 2020 to surpass $2,800, but Rentals.ca and Bullpen expect December 2020 rent to be $2,770 per month, a 7% annual increase. This forecast is a moderation from the 11% annual growth forecasted by Rentals.ca and Bullpen last year, which was a little too bullish, as condo rental rates have moderated more than expected (+4%), despite the more pronounced increase in rental rates for purpose-built apartments (+9%) and single-family homes (+11%).
Based on strong pre-construction condominium apartment sales from 2016, the level of condo apartment completions is expected to rise rapidly in 2020 based on this typical 4-year sales to occupancy lag. However, elevated population growth, and a recovering resale housing market will continue to price-out first-time buyers and should offset some of that increases condo rental supply.
Mississauga
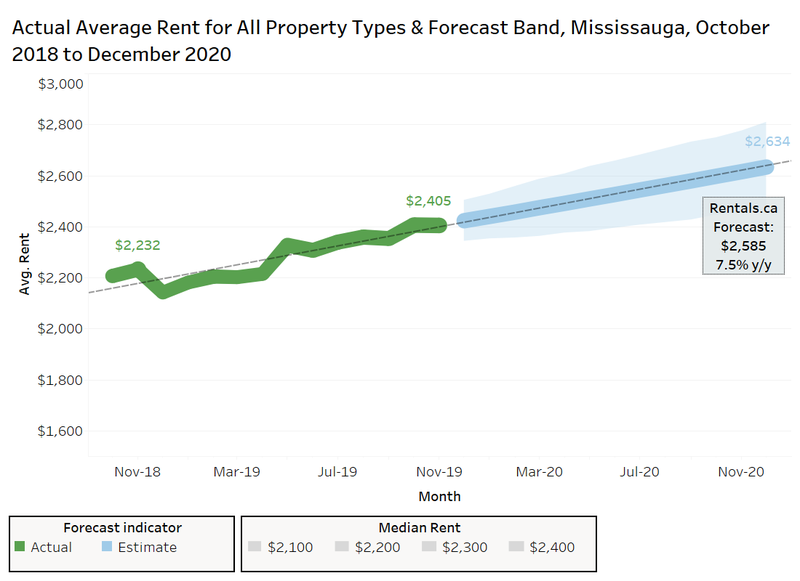
The chart below looks at the average rent for all property types in Mississauga from October 2018 to November 2019, and the Rentals.ca and Bullpen Consulting forecast for 2020.
In November of 2018, the average rental rate was $2,232 for all property types listed on Rentals.ca in Mississauga, that rate increased to $2,405 for November 2019, an increase of 10.2% annually. Overall in 2019, the average rent was $2,504 per month.
The linear forecast calls for average rent in 2020 to surpass $2,600, but Rentals.ca and Bullpen forecast that December 2020 rent will be $2,585 per month on average, an 8% annual increase. This forecast is a slight moderation from the correct 10% annual growth forecasted from December 2018.
Mississauga will continue to move in parallel with the former City of Toronto with prospective renters fleeing Toronto for less expensive units or larger properties.
Ottawa
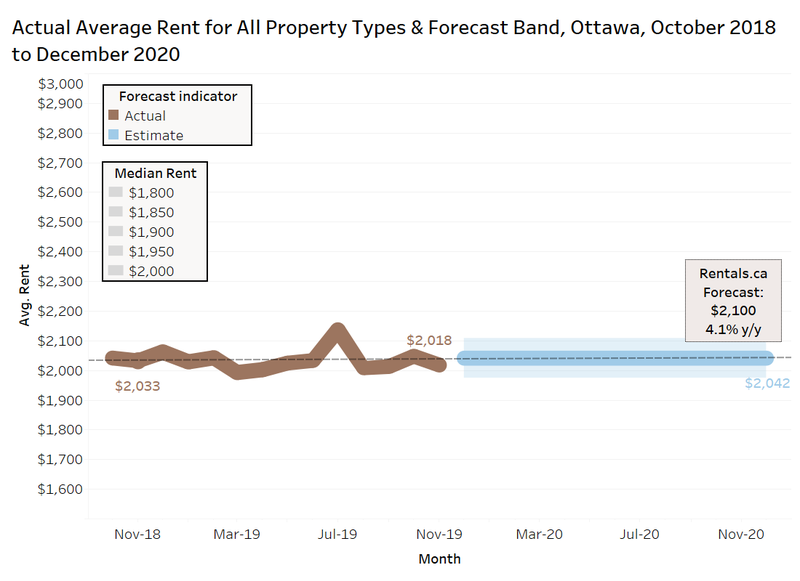
The chart below looks at the average rent for all property types in Ottawa from October 2018 to November 2019, and the Rentals.ca and Bullpen Consulting forecast for 2020.
In November of 2018, the average rental rate was $2,029 for all property types listed on Rentals.ca. That rate decreased to $2,018 for November 2019, a decline of 0.5% annually. Overall in 2019, the average rent in Ottawa was $2,032 per month. The decline for all property types is in contrast to the annual increase of 9% for condos and rental apartments presented earlier. The changing composition of listings contributes to some of these data anomalies, which can occur despite a robust sample of listings.
The forecast calls for average rent in 2020 overall to be $2,042 with December 2020 rent at $2,100 per month, a 4% annual increase. This forecast is a moderation from the 9% annual growth forecasted by Rentals.ca and Bullpen last year, which was accurate for condo and rental apartments, but a big miss for the rental market overall.
The resale ownership housing market in Ottawa has really started to pick up, and that should have the impact of pulling up rental rates as first-time buyers are priced out.
Montreal
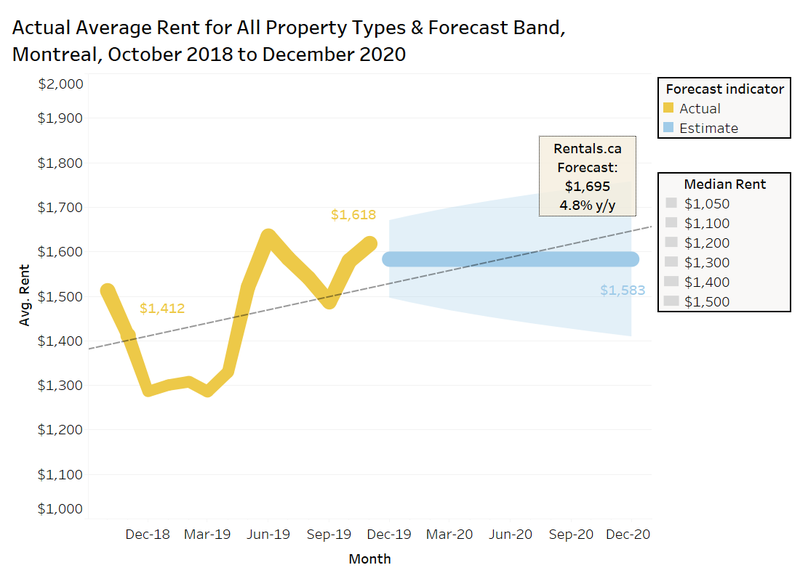
The chart below looks at the average rent for all property types in Montreal from October 2018 to November 2019, and the Rentals.ca and Bullpen Consulting forecast for 2020.
In November of 2018, the average rental rate was $1,412 for all property types listed on Rentals.ca. That rate increased to $1,618 for November 2019, an increase of 24.4% annually. The sample size of listing in Montreal is large, so the rent spike and monthly volatility wouldn’t typically be expected, but is an illustration of the wide variety of rental product in Montreal and that suites are getting snapped up quickly, and not lingering on Rentals.ca for months without being leased. Overall in 2019, the average rent in Montreal was $1,472 per month.
The forecast calls for average rent in 2020 of $1,583, but Rentals.ca and Bullpen expect December 2020 rent to be $1,695 per month, a 5% annual increase. Given the volatility in the monthly figures, there is a wide forecast band, but rent is expected to grow at twice the rate of inflation.
















 The data relating to real estate on this website comes in part from the MLS® Reciprocity program of either the Greater Vancouver REALTORS® (GVR), the Fraser Valley Real Estate Board (FVREB) or the Chilliwack and District Real Estate Board (CADREB). Real estate listings held by participating real estate firms are marked with the MLS® logo and detailed information about the listing includes the name of the listing agent. This representation is based in whole or part on data generated by either the GVR, the FVREB or the CADREB which assumes no responsibility for its accuracy. The materials contained on this page may not be reproduced without the express written consent of either the GVR, the FVREB or the CADREB.