RSS

Canada Rental Property Tax Guide: Which Expenses Are Deductible?

前言PREFACE 

在加拿大,出租物业的收入是需要报税的,无论是短期还是长期出租。根据加拿大税法,租赁收入被视为收入来源之一,必须在个人或企业的税务申报中列出。

尽管出租收入需要报税,但你可以抵扣与租赁物业相关的费用,从而减少应纳税收入

1.贷款利息 INTEREST
如果你为出租物业贷款,抵押贷款的利息部分是可以抵扣的。需要注意的是,只有贷款利息才能抵扣,而不是本金部分。


2. 地税 TAX
物业税是你每年支付给地方政府的税款,这笔费用可以作为出租物业的运营成本进行抵扣

3.保险费INSURNCE
与出租物业相关的保险费用(例如财产保险、房东责任保险等)也是可以抵扣的。

4.维修费 REPAIR

与物业相关的维修和维护费用(例如修理漏水、修复电气系统、清理外部区域等)是可以抵扣的。需要区分的是,维护费用(例如油漆、清理等)可以抵扣,但如果是进行改善(如增建房间或大规模翻修),则通常无法直接抵扣。

5.管理费 MANAGEMENT

如果你雇佣了物业管理公司来管理你的出租物业,那么支付给管理公司的费用可以抵扣。这包括收租、维护、广告等管理服务的费用。

6.公用事业费 UTILITY

如果你作为房东支付了公用事业费用(如水、电、气、垃圾清理等),这些费用是可以抵扣的。前提是这些费用与你出租物业的运营有关。如果租户负责支付这些费用,就不能抵扣。

7.广告费 ADVERTISEMENT

用于出租物业的广告费用(如线上广告、报纸广告等)可以作为业务费用抵扣。

8.专业服务费 PROFESSIONAL

如果你聘请了会计师、律师或其他专业服务提供者来帮助管理出租物业(如准备税务文件或租赁合同),这些费用是可以抵扣的。

9.交通费 TRANSPORTATION

如果你需要亲自去出租物业进行管理、检查或维修,相关的旅行和交通费用也可以抵扣。这包括油费、维修费用以及与出租物业相关的其他交通费用。

10.清洁费 CLEANING

任何用于物业清洁的费用(例如聘请清洁服务或购买清洁用品)也是可抵扣的。

11.折旧费CCA

你可以为出租物业的建筑和其他长期资产(如家具、设备等)申请折旧,也称为资本成本补偿(CCA)。这意味着你可以逐年将这些资产的价值损失作为费用抵扣。

12.租客损坏费 DAMAGE

如果租户对物业造成了损坏,并且你需要支付修理费用来修复这些损坏,这些费用也可以抵扣。

Princess 谈房说地 COMMENTS

出租物业必须报税,而且合理申报抵扣费用可以帮助你减少税务负担。

物业出租是一门精细化的管理艺术

如需出租您的物业,欢迎联系Princess,让您安心,收益稳定!

查找出租房源,欢迎访问Princess官网查询!
https://princesspan.com/vancouver-rental-listings.html


无论您计划购买、出售还是管理住宅或商业地产,Princess——住宅和商业地产领域的资深专家,提供全方位一站式服务。我们致力于为您提供精准的市场分析、降低投资风险并最大化您的投资回报。让我们携手合作,助您在房地产市场中取得成功。

Read

Considering Relocating to Canada After Donald Trump’s Presidential Win? Here Are the Best Places to Live in the Country.

Canada’s neighborhoods each offer their own unique appeal. Whether you prioritize modern amenities or a deep cultural heritage, there are areas that cater to a wide range of preferences.

Relocating to Canada is a major decision, requiring thoughtful consideration of factors such as career opportunities, cultural integration, and lifestyle.

Ultimately, the ideal place to live is one that aligns with your personal values and meets your specific needs.

https://dailyhive.com/vancouver/move-to-canada-best-places-live

Read

Vancouver Housing Market Update Year 2023 | 温哥华每月房产报告-2023年

Metro Vancouver housing market shows resilience in 2023, ending the year in balanced territory

Metro Vancouver’s housing market closed out 2023 with balanced market conditions, but the year-end totals mask a story of surprising resilience in the face of the highest borrowing costs seen in over a decade. 

The Real Estate Board of Greater Vancouver (REBGV) reports that residential sales in the region totalled 26,249 in 2023, a 10.3 per cent decrease from the 29,261 sales recorded in 2022, and a 41.5 per cent decrease from the 44,884 sales in 2021. 
Last year’s sales total was 23.4 per cent below the 10-year annual sales average (34,272). 

For newsletter: Please click here

Read

FOR RENT: Like New Luxury Furnished House in Dunbar Vancouver

Highlights:

  • Property addressL 4*** W 28th Av
  • Location: 4*** w 28th Av, Vancouver
  • Rent: $12,800/month
  • Available: Now
  • Furnishing: Furnished, can be unfurnished
  • Property Type: Detached House
  • Bedrooms : 7
  • Bedrooms: 4.5
  • Living Space: 3,900 SF
  • Parking : 3 car garage
  • Utilities and Internet: Not Included


For Viewing: Please email to book an appointment with a brief intro of yourself.

_____________________________________________________________________________

Features:

  • Prime Dunbar neighborhood
  • Meticulously newly renovated by a renowned designer, blending modern living with fine art craftsmanship
  • Spacious 7 bedrooms  and 5 bedrooms house with over 3,900 sf
  • Radiant heat, air conditioning, and central vacuum
  • Master bathroom features spa-like amenities: steam shower, body spray, and rain shower
  • Real marble and granite countertops adorn every surface
  • Versatile basement: legal 3-bedroom rental suite for income or private recreational sanctuary
  • Basement amenities include a high-end bar, wine cellar, and theatre room
  • Top school nearby:  Lord Byng Secondary School, St. George’s school, Crofton House school

_________________⁠

⁠ Realtor®,

Residential | Commercial⁠

RE/MAX Crest Realty⁠ 

info@princesspan.com⁠

www.PrincessPan.com⁠

Wechat: PrincessPanRealtor⁠

Read

Vancouver Housing Market Report-December

Metro Vancouver housing market shows resilience in 2020


Strong December activity brought Metro Vancouver’s* 2020 home sales total in line with the region’s long-term annual average.


The Real Estate Board of Greater Vancouver (REBGV) reports that residential home sales in the region totalled 30,944 in 2020, a 22.1 per cent increase from the 25,351 sales recorded in 2019, and a 25.7 per cent increase from the 24,619 homes sold in 2018.


Last year’s sales total was 2.8 per cent below the 10-year sales average.


“When the pandemic began in March, the housing market came to a near standstill. We knew, however, that shelter needs don’t go away in times of crisis, they intensify," Colette Gerber, REBGV Chair said. “The real estate community worked closely with our regulatory bodies and public health officials in the spring to ensure appropriate precautions and protocols were implemented so BC REALTORS® could help residents safely meet their housing needs."


Home listings on the Multiple Listing Service® (MLS®) in Metro Vancouver reached 54,305 in 2020. This is a 4.6 per cent increase compared to the 51,918 homes listed in 2019 and a 1.3 per cent increase compared to the 53,614 homes listed in 2018.


Last year’s listings total was 2.7 per cent below the region’s 10-year average.


“After adapting to the COVID-19 environment, local home buyer demand and seller supply returned at a steady pace throughout the summer, fall and winter seasons," Gerber said. "Shifting housing needs and low interest rates were key drivers of this activity in 2020. Looking ahead, the supply of homes for sale will be a critical factor in determining home price trends in 2021.”


The MLS® HPI composite benchmark price for all residential properties in Metro Vancouver ends the year at $1,047,400. This is a 5.4 per cent increase compared to December 2019.


The benchmark price for apartments increased 2.6 per cent in the region last year. Townhomes increased 4.9 per cent and detached homes increased 10.2 per cent.


December Summary


REBGV reports that residential home sales in the region totalled 3,093 in December 2020, a 53.4 per cent increase from the 2,016 sales recorded in December 2019, and a 0.9 per cent increase from the 3,064 homes sold in November 2020.


Last month’s sales were 57.7 per cent above the 10-year December sales average and is the highest total for the month on record.


“Robust December sales outpaced long-term averages in what’s traditionally the quietest month of the year in real estate. This was part of an unusual seasonal pattern the market followed last year, which can be attributed in large part to the pandemic,” Gerber says.


There were 2,409 detached, attached and apartment properties newly listed for sale on the MLS® in Metro Vancouver in December 2020. This represents a 51.7 per cent increase compared to the 1,588 homes listed in December 2019 and a 40.8 per cent decrease compared to November 2020 when 4,068 homes were listed.


The total number of homes currently listed for sale on the MLS® system in Metro Vancouver is 8,538, a 0.8 per cent decrease compared to December 2019 (8,603) and a 23.2 per cent decrease compared to November 2020 (11,118).


For all property types, the sales-to-active listings ratio for December 2020 is 36.2 per cent. By property type, the ratio is 35.2 per cent for detached homes, 50.4 per cent for townhomes, and 33.1 per cent for apartments.


Generally, analysts say downward pressure on home prices occurs when the ratio dips below 12 per cent for a sustained period, while home prices often experience upward pressure when it surpasses 20 per cent over several months.


Sales of detached homes in December 2020 reached 1,026, a 71.3 per cent increase from the 599 detached sales recorded in December 2019. The benchmark price for detached homes is $1,554,600. This represents a 10.2 per cent increase from December 2019 and a one per cent increase compared to November 2020.


Sales of apartment homes reached 1,474 in December 2020, a 40 per cent increase compared to the 1,053 sales in December 2019. The benchmark price of an apartment property is $676,500. This represents a 2.6 per cent increase from December 2019 and is unchanged from November 2020.


Attached home sales in December 2020 totalled 593, a 62.9 per cent increase compared to the 364 sales in December 2019. The benchmark price of an attached home is $813,900. This represents a 4.9 per cent increase from December 2019 and a 0.1 per cent decrease compared to November 2020.

Read

Vancouver Housing Market Report-November

Home sale and listing resurgence extends into the fall


Home sale and new listing activity remained at near record levels across Metro Vancouver in October.


The Real Estate Board of Greater Vancouver (REBGV) reports that residential home sales in the region totalled 3,687 in October 2020, a 29 per cent increase from the 2,858 sales recorded in October 2019, and a 1.2 per cent increase from the 3,643 homes sold in September 2020.


Last month’s sales were 34.7 per cent above the 10-year October sales average and stands as the second-highest total on record for the month.


“Home has been a focus for residents during the pandemic. With more days and evenings spent at home this year, people are re-thinking their housing situation," Colette Gerber, REBGV Chair said. “Throughout this period, REALTORS® have been working to understand and adapt to the latest safety protocols so that they can continue to help the public meet their housing needs in a safe and responsible way.”


There were 5,571 detached, attached and apartment homes newly listed for sale on the Multiple Listing Service® (MLS®) in Metro Vancouver in October 2020. This represents a 36.7 per cent increase compared to the 4,074 homes listed in October 2019 and a 13 per cent decrease compared to September 2020 when 6,402 homes were listed. 


The total number of homes currently listed for sale on the MLS® system in Metro Vancouver is 12,416, a 1.5 per cent increase compared to October 2019 (12,236) and a 5.2 per cent decrease compared to September 2020 (13,096).


“With demand on the rise, homes priced right for today’s market are receiving attention and, at times, garnering multiple offers," Gerber said. "To understand the market conditions in your neighbourhood and property type of choice, work with your local REALTOR® to assess the latest MLS® housing market information."


For all property types, the sales-to-active listings ratio for October 2020 is 29.7 per cent. By property type, the ratio is 30.9 per cent for detached homes, 43.5 per cent for townhomes, and 24.9 per cent for apartments.


Generally, analysts say downward pressure on home prices occurs when the ratio dips below 12 per cent for a sustained period, while home prices often experience upward pressure when it surpasses 20 per cent over several months.


The MLS® Home Price Index composite benchmark price for all residential properties in Metro Vancouver is currently $1,045,100. This represents a six per cent increase over October 2019 and a 0.4 per cent increase compared to September 2020.


Sales of detached homes in October 2020 reached 1,335, a 42.3 per cent increase from the 938 detached sales recorded in October 2019. The benchmark price for a detached home is $1,523,800. This represents an 8.5 per cent increase from October 2019 and a 1.1 per cent increase compared to September 2020.


Sales of apartment homes reached 1,570 in October 2020, a 13.4 per cent increase compared to the 1,384 sales in October 2019. The benchmark price of an apartment property is $683,500. This represents a 4.4 per cent increase from October 2019 and is unchanged compared to September 2020.


Attached home sales in October 2020 totalled 782, a 45.9 per cent increase compared to the 536 sales in October 2019. The benchmark price of an attached home is $813,000. This represents a 5.4 per cent increase from October 2019 and a 0.4 per cent increase compared to September 2020.


Read

【加拿大商业地产】投资综述

加拿大一直以来都以丰富的天然资源,发达的科技,稳定的政府,对外开放的态度,优质的教育和高水平生活品质等吸引着来自全世界各地的移民和投资者来安家和投资,尤其是在多伦多和温哥华等人口密集的大城市成为投资热点。


而温哥华,用绝对优势天然气候和地理位置在过去的十几年里一直霸占着全世界最宜居的城市前十名成为大多数投资者的首选之地,这也让越来越越多的投资人投身于房地产行业中. 然而从2016年开始,由于BC省政府的宏观调控增加15%的外国买家税,以及随后在2018年又修改成20%和额外的投机税, 这让很多海外投资者不舍得放弃了温哥华市场。


然而,你知道吗?投资千万条,住宅投资却不是唯一条。在加拿大地产投资除了住宅房地产投资,还有商业地产投资, 而且商业地产投资是没有外国买家税!


什么是商业地产(CRE)?


商业地产(CRE)是专门用于与商业相关的目的或用于提供工作空间而不是居住场所的地产项目。通常,商业投资者将通过把商业房地产出租给商户收取租金来获取收益。商业房地产的种类繁多,从单个店面到大型购物中心应有尽有。


商业房地产包括多个类别,例如各种零售,办公场所,酒店和度假村,购物中心,餐馆和医疗保健所等。


关键要点


  • 商业房地产是指专门用于商业或盈利目的的房地产。

  • 商业房地产的四个主要类别包括:办公楼,工业厂房,多户出租和零售。

  • 商业房地产为投资者提供租金收入以及潜在的资本增值。

  • 与住宅房地产相比,投资商业房地产通常需要更多的投资经验和投入资金。

  • 公开交易的房地产投资信托(REITs)是个人间接投资商业房地产的可行途径。


商业地产的基础知识


商业地产与住宅房地产共同构成了房地产的两个主要类别。住宅物业包括为人类居住而保留的结构,不得用于商业或工业用途。顾名思义,商业地产用于商业活动,而作为多单元租赁的出租物业也被归类为房东的商业活动。


根据功能,商业地产通常分四类:


  1. 办公楼

  2. 工业厂房

  3. 多户出租

  4. 零售


各个类别还可以进一步分类。例如,办公楼通常可以分为A级,B级或C级。


A级:中央商务区的高层建筑美学,年龄,基础设施质量和位置方面等方面代表了最好的建筑物。由专业公司管理,最高的租金。


B级:办公楼通常稍旧,租金不如A级建筑物具有竞争力。投资者经常将这些建筑物作为翻新目标, 使其恢复为A级。


C级:较旧的办公楼,通常超过20年,非核心地区,需要维护。通常针对重新开发。


下期预告--加拿大商业地产:商业租赁


Read

Canada December 2019 Rent Report

Average rental rates nationally for all property types declined for the second consecutive month, but are still up 9.4% annually. Surprisingly, the increase in rents is supported by some of the smaller municipalities such as London, Hamilton, Kanata, Burlington, and Kitchener, which are all experiencing double-digit rent growth when considering all property types.


National Overview

1 Canada D.png

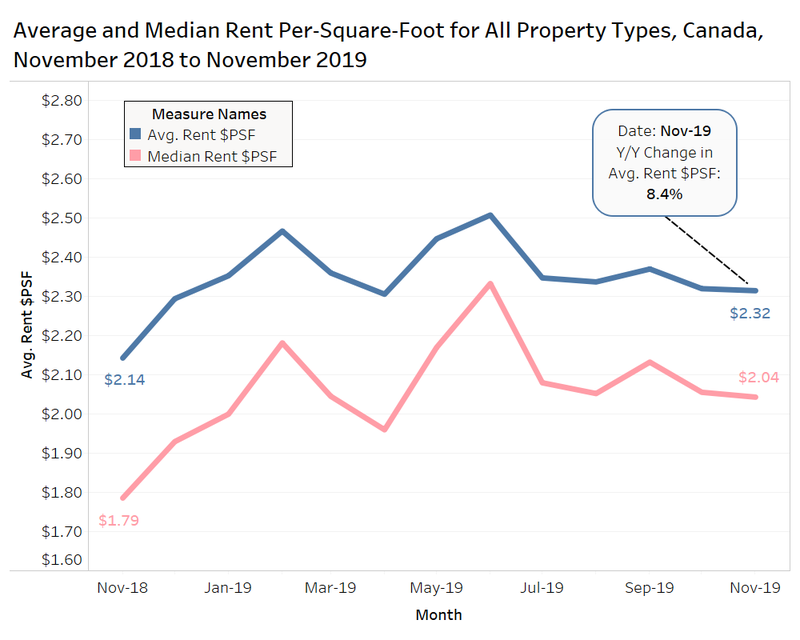
When comparing the change in rent monthly, quarterly or annually, it is important to understand if the composition of the sample of transactions is changing. A way to look at rent that controls for changes in the size of properties is to look at the rent per-square-foot (psf).


The average rent per-square-foot nationally for all property types has increased by 8.4% annually from $2.14 psf in November 2018 to $2.32 psf. However, the average rent per-square-foot has been fairly flat since July.


It must be kept in mind, landlords and property owners do not list (or know) the unit size for every property on Rentals.ca, and these figures represent a smaller sample size in comparison to the total listings, which is more heavily weighted with Ontario and British Columbia urban markets, where every square foot counts, and there are more new units where the unit size is known.


To add another caveat, landlords with very small units may not list the unit size even though they know it, because they it might prevent prospective tenants from calling or viewing the suite. This is important because the smallest units typically have the highest rent per-square-foot outside of penthouses and units with expansive balconies.
2 Rent $PSF.png

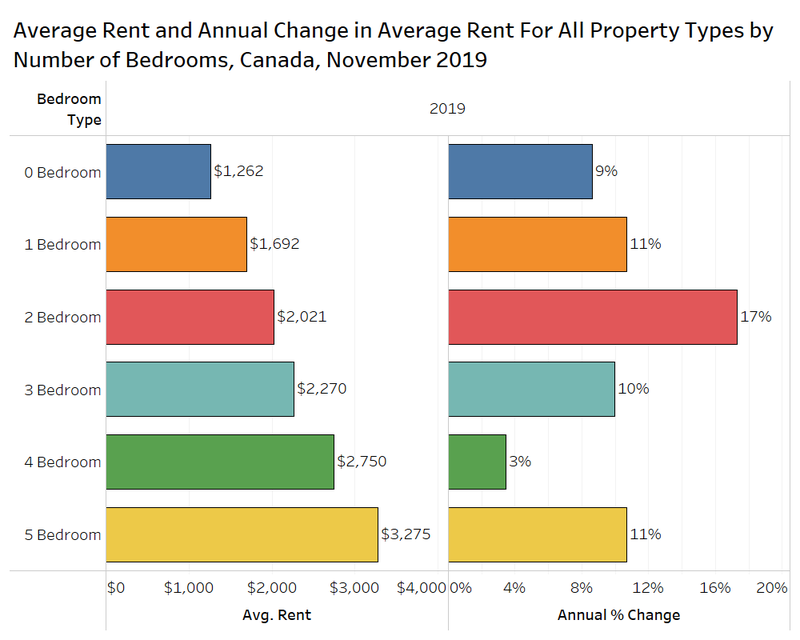
The 8%-9% rent increase over the past year is not consistent across built forms and bedroom types. The chart below looks at the average rent by bedroom type for all properties listed on Rentals.ca in November. The data shows two-bedroom units have experienced the highest annual growth at 17%, followed by one-bedroom and five-bedroom units at 11%, and three-bedroom units at 10%.
2 Bed Types.png

According to survey data from Statistics Canada, 27% of people who moved over the past five years did so to move to a larger or more high-quality dwelling. Tenants want more space, and two bedrooms have always been a very desirable suite among renters. In November, two-bedroom units made up 37.9% of listings on Rentals.ca, just edging out one-bedroom units at 37.8%.


Across the country, two-bedroom units from 900 sf to 1,100 sf have been popular and experiencing strong rent growth nationally.


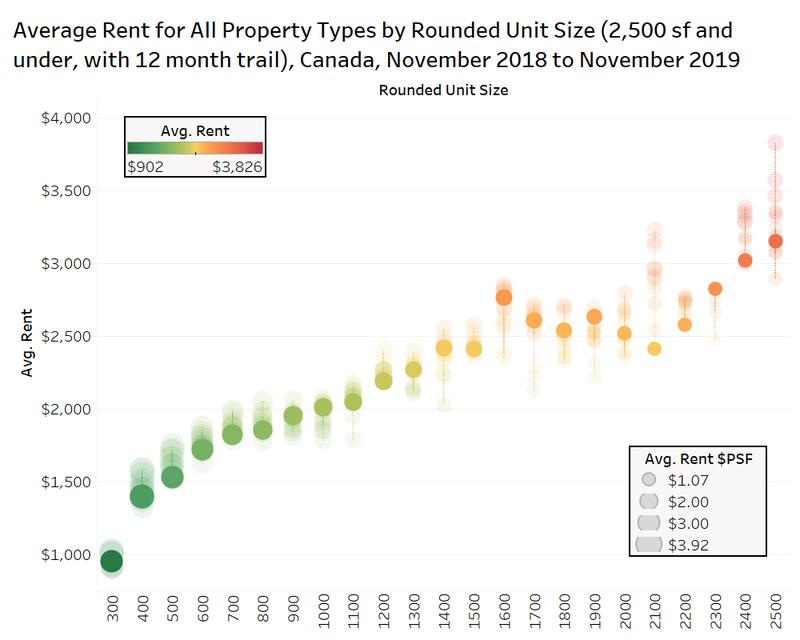
The chart below looks at the average rent by rounded unit size for all property types in Canada in November 2019, with the last 12 monthly readings shown via the faded markers (square footage is rounded to the nearest hundredth).

The highest annual appreciation in rents is occurring for units from 1,600 sf to 1,900 sf, with the higher point in that range being units rounded to 1,900 sf, which are up 19% annually. The second grouping experiencing the high growth is units from 900 sf to 1,100 sf, which are up between 8% and 15%. The slowest annual growth is occurring in the 2,000 sf to 2,200 sf range (the sample size is small) and in the 1,200 sf to 1,500 sf range.
4 Rounded Unit.png

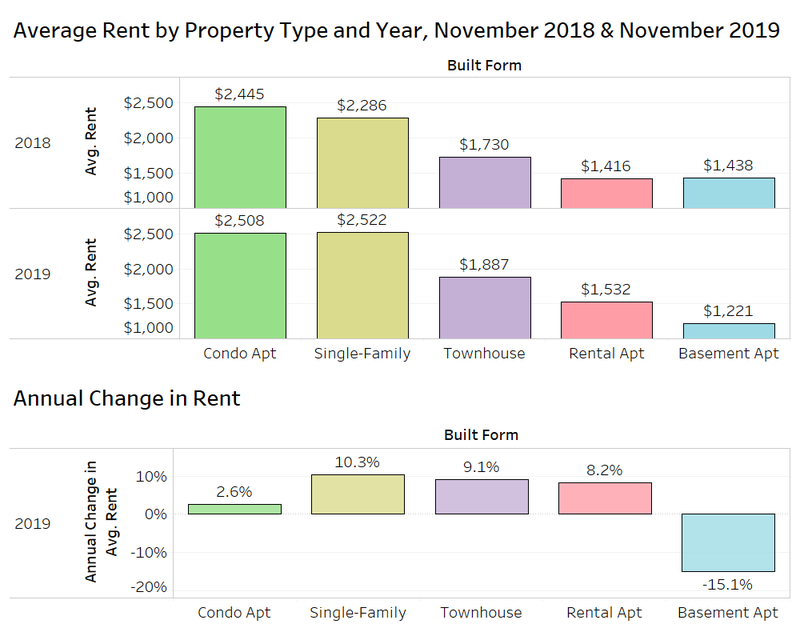
Single-family homes (single-detached and semi-detached) experienced the highest annual price growth among property types in Canada at 10.3%, rising from $2,286 per month in November 2018 to $2,522 per month in November 2019.


Townhouses increased by 9.1% annually, rental apartments grew by 8.2% annually, while condominium apartments lagged with growth of just 2.6%. Basement apartments declined year-over-year, but the sample size is small, and the results are not likely an indication of a big drop in demand for this property type.
5 Built Form.png

Provincial Rental Rates

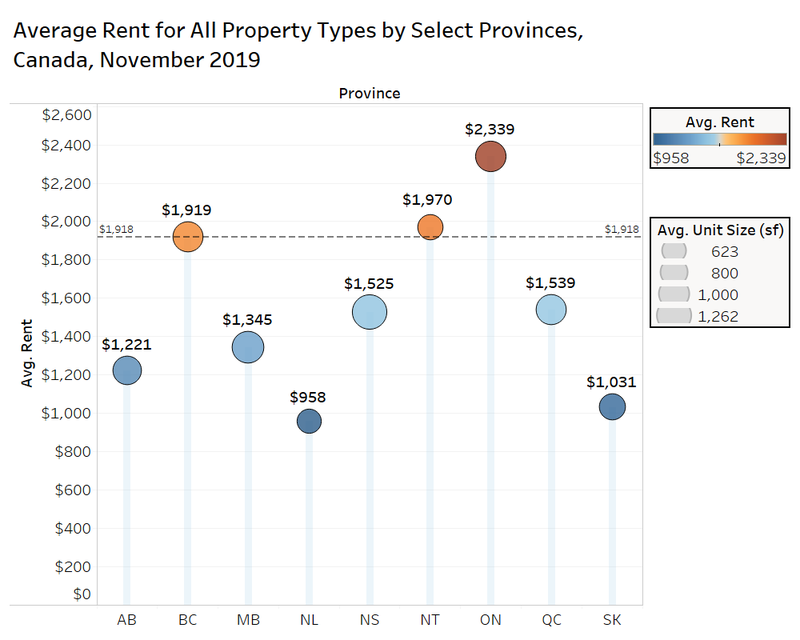
On a provincial level, Ontario had the highest rental rates in November, with landlords seeking $2,339 per month on average (all property types), up from $2,334 in October, and 9.1% annually from $2,144 in November of 2018.

In Saskatchewan, the average monthly rent declined 9.7% annually, while average rents in Alberta are down 3%.

6 Provinces.png

Municipal Rental Rates

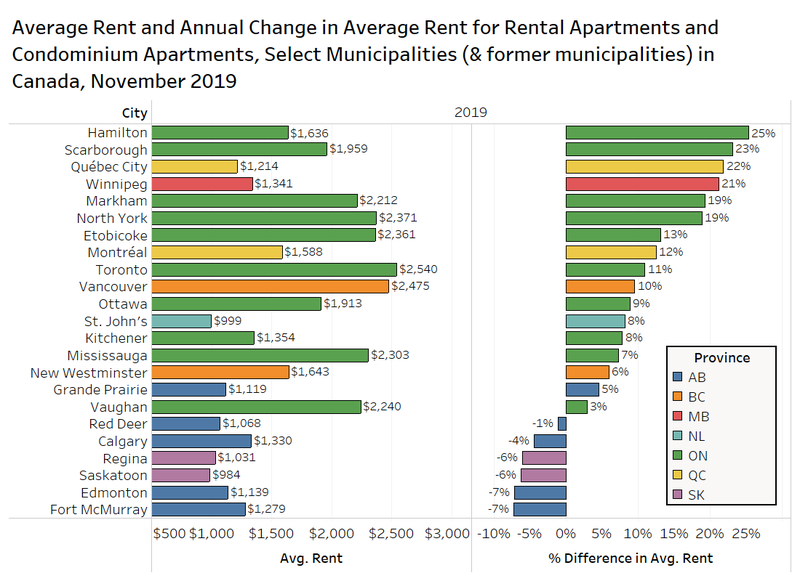
The majority of listings on Rentals.ca are rental and condominium apartments, and the chart below looks at the average rent and the annual change in average rent for a select number of Canadian municipalities (and former municipalities prior to amalgamation) in November 2019.


As was the case in October, Hamilton and Scarborough led the pack with year-over-year rent growth of 25% and 23%, respectively for apartments with rental or condo tenure.


Two of the more affordable Canadian rental markets, Quebec City and Winnipeg, have both experienced a significant jump in rent year-over-year, increasing by 22% and 21%, respectively.


On the other extreme are the municipalities in Alberta and Saskatchewan, with Red Deer, Calgary, Regina, Saskatoon, Edmonton and Fort McMurray all seeing average rents for apartments decline from November 2018 to November 2019. The declines range from 1% to 7% annually.
7 Munit D.png


2020 Forecasts

Vancouver


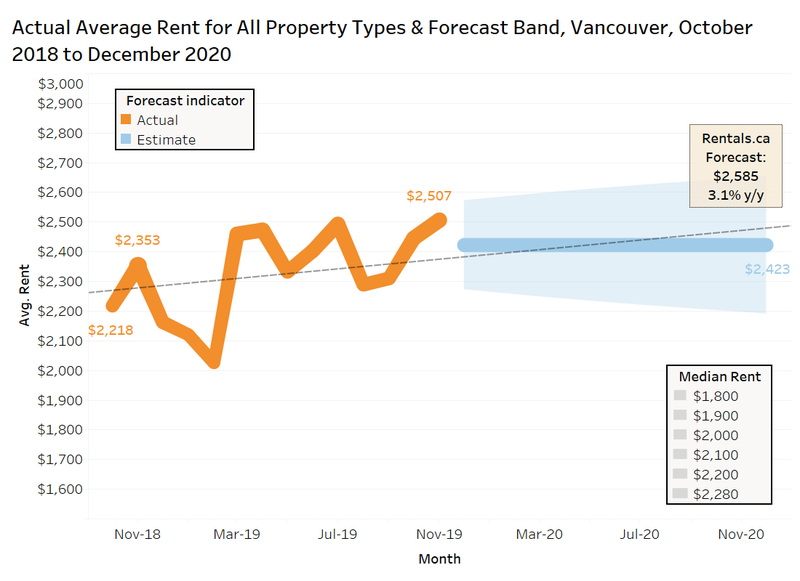
The chart below looks at the average rent for all property types in Vancouver from October 2018 to November 2019, and the Rentals.ca and Bullpen Consulting forecast for 2020.


In November of 2018, the average rental rate was $2,353 for all property types listed on Rentals.ca. That rate increased to $2,507 for November 2019, an increase of 6.5% annually. Overall in 2019, the average rent in Vancouver was $2,351 per month (through 11 months).


The forecast calls for average rent in 2020 overall to be $2,423, with December 2020 rent at $2,585 per month, a 3% annual increase (3.1% from November 2019). This forecast is a moderation from the 7% annual growth forecasted by Rentals.ca and Bullpen last year.


New rental apartment completions are expected to rise in Vancouver in 2020, coupled with relatively flat resale market conditions, should result in less rent inflation.
8 Van D.png

Calgary


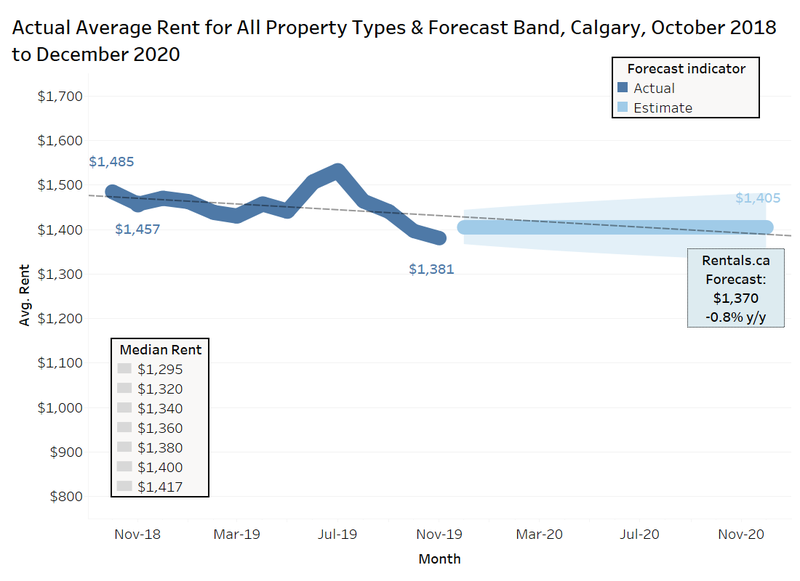
The chart below looks at the average rent for all property types in Calgary from October 2018 to November 2019, and the Rentals.ca and Bullpen Consulting forecast for 2020.


In November of 2018, the average rental rate was $1,457 for all property types listed on Rentals.ca, that rate decreased to $1,381 by November 2019, a decrease of 5.2% year-over-year. Overall in 2019, the average rent in Calgary was $1,450 per month.


The forecast calls for average rent in 2020 overall to be $1,405, with December 2020 rent at $1,370 per month, a 1% annual decline. This forecast is a moderation from the 4% annual growth forecasted by Rentals.ca and Bullpen last year, which clearly put excess weight on some of the positive economic data at this time last year.

A continued slump in the energy sector should continue to keep rents flat in 2020.
9 Cal D.png

Edmonton


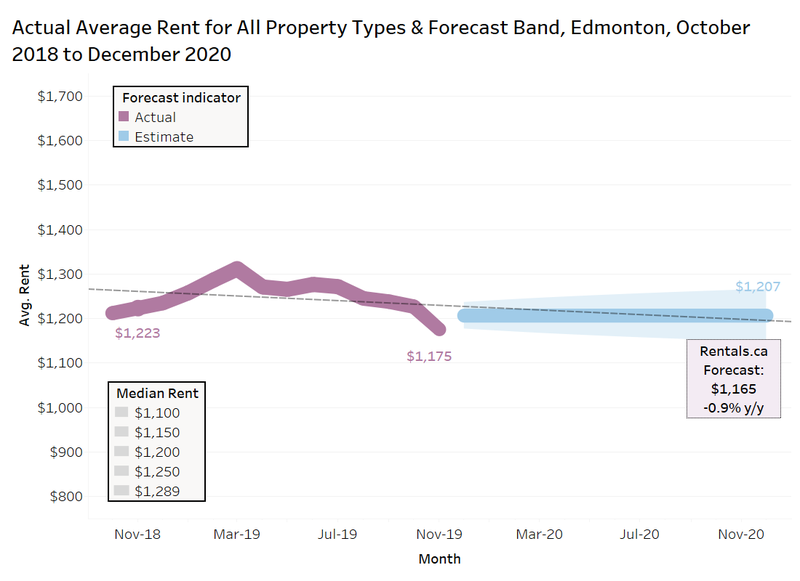
The chart below looks at the average rent for all property types in Edmonton from October 2018 to November 2019, and the Rentals.ca and Bullpen Consulting forecast for 2020.


The average rental rate was $1,223 for all property types listed on Rentals.ca in November 2018, that rate decreased to $1,175 for November 2019, a drop of 3.9% annually. Overall in 2019, the average rent in Edmonton was $1,257 per month.


The forecast calls for average rent in 2020 overall to be $1,207 for all property types, with December 2020 rent at $1,165 per month, a 1% annual decline. This forecast is similar to the zero growth forecasted for Edmonton by Rentals.ca and Bullpen in 2018. The forecast of 0% rent change was on track in the first half over the year, but rents slumped in the second half of 2019. Like Calgary, the continued uncertainties in oil-related industries should continue to keep rents flat in 2020.10 EdM D.png

Toronto


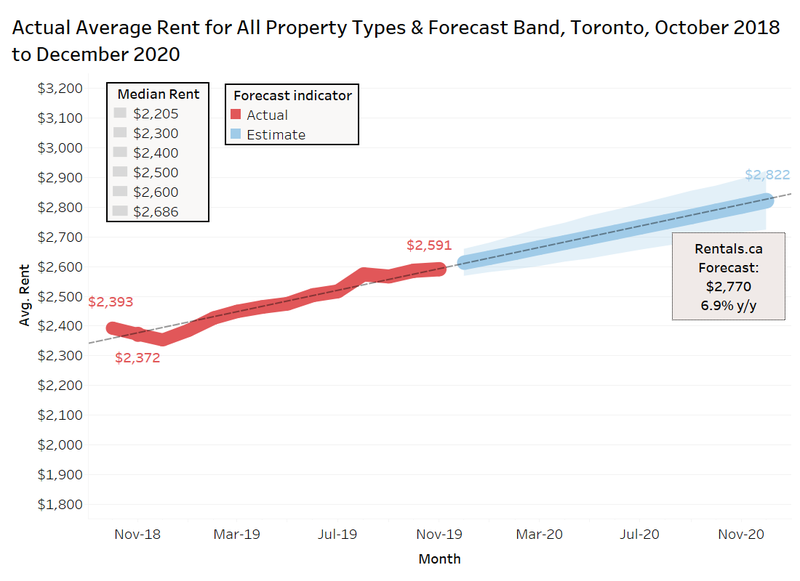
The chart below looks at the average rent for all property types in the former City of Toronto (pre-amalgamation) from October 2018 to November 2019, and the Rentals.ca and Bullpen Consulting forecast for 2020.


In November of 2018, the average rental rate was $2,385 for all property types listed on Rentals.ca, that rate increased to $2,591 for November 2019, an increase of 8.6% annually. Overall in 2019, the average rent in Toronto was $2,504 per month.


The linear forecast calls for average rent in 2020 to surpass $2,800, but Rentals.ca and Bullpen expect December 2020 rent to be $2,770 per month, a 7% annual increase. This forecast is a moderation from the 11% annual growth forecasted by Rentals.ca and Bullpen last year, which was a little too bullish, as condo rental rates have moderated more than expected (+4%), despite the more pronounced increase in rental rates for purpose-built apartments (+9%) and single-family homes (+11%).


Based on strong pre-construction condominium apartment sales from 2016, the level of condo apartment completions is expected to rise rapidly in 2020 based on this typical 4-year sales to occupancy lag. However, elevated population growth, and a recovering resale housing market will continue to price-out first-time buyers and should offset some of that increases condo rental supply.
11 Tor D.png

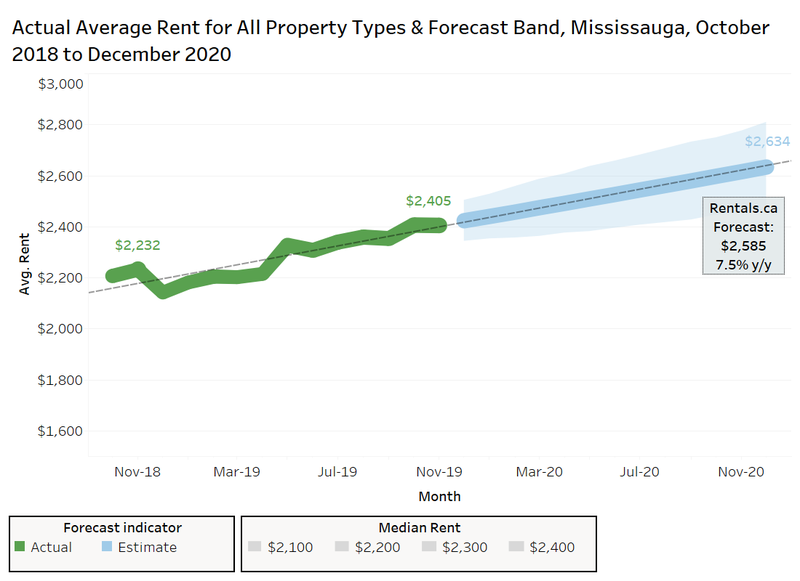
Mississauga


The chart below looks at the average rent for all property types in Mississauga from October 2018 to November 2019, and the Rentals.ca and Bullpen Consulting forecast for 2020.


In November of 2018, the average rental rate was $2,232 for all property types listed on Rentals.ca in Mississauga, that rate increased to $2,405 for November 2019, an increase of 10.2% annually. Overall in 2019, the average rent was $2,504 per month.


The linear forecast calls for average rent in 2020 to surpass $2,600, but Rentals.ca and Bullpen forecast that December 2020 rent will be $2,585 per month on average, an 8% annual increase. This forecast is a slight moderation from the correct 10% annual growth forecasted from December 2018.


Mississauga will continue to move in parallel with the former City of Toronto with prospective renters fleeing Toronto for less expensive units or larger properties.
12 Miss D.png

Ottawa


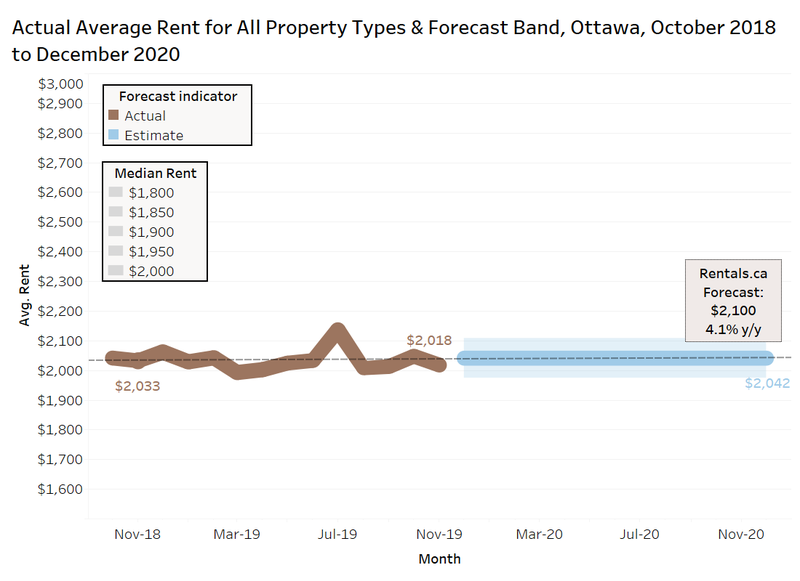
The chart below looks at the average rent for all property types in Ottawa from October 2018 to November 2019, and the Rentals.ca and Bullpen Consulting forecast for 2020.


In November of 2018, the average rental rate was $2,029 for all property types listed on Rentals.ca. That rate decreased to $2,018 for November 2019, a decline of 0.5% annually. Overall in 2019, the average rent in Ottawa was $2,032 per month. The decline for all property types is in contrast to the annual increase of 9% for condos and rental apartments presented earlier. The changing composition of listings contributes to some of these data anomalies, which can occur despite a robust sample of listings.


The forecast calls for average rent in 2020 overall to be $2,042 with December 2020 rent at $2,100 per month, a 4% annual increase. This forecast is a moderation from the 9% annual growth forecasted by Rentals.ca and Bullpen last year, which was accurate for condo and rental apartments, but a big miss for the rental market overall.


The resale ownership housing market in Ottawa has really started to pick up, and that should have the impact of pulling up rental rates as first-time buyers are priced out.
13 Ott D.png

Montreal


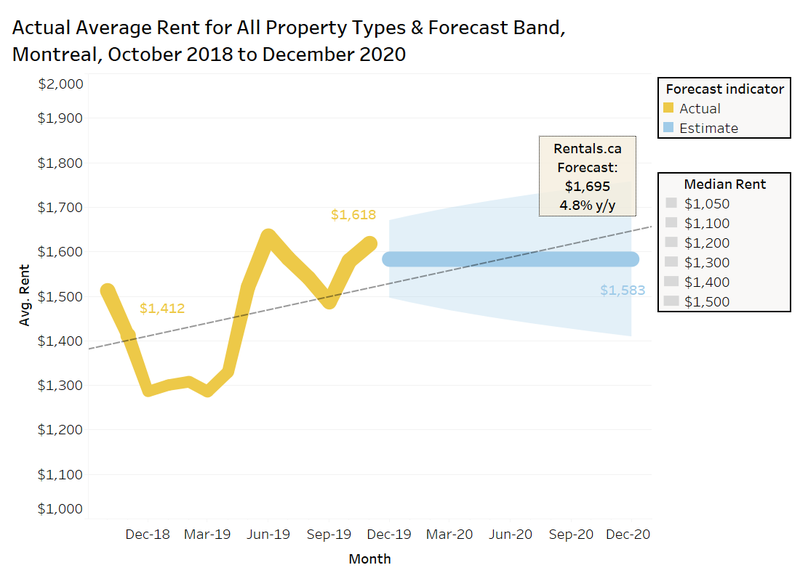
The chart below looks at the average rent for all property types in Montreal from October 2018 to November 2019, and the Rentals.ca and Bullpen Consulting forecast for 2020.


In November of 2018, the average rental rate was $1,412 for all property types listed on Rentals.ca. That rate increased to $1,618 for November 2019, an increase of 24.4% annually. The sample size of listing in Montreal is large, so the rent spike and monthly volatility wouldn’t typically be expected, but is an illustration of the wide variety of rental product in Montreal and that suites are getting snapped up quickly, and not lingering on Rentals.ca for months without being leased. Overall in 2019, the average rent in Montreal was $1,472 per month.


The forecast calls for average rent in 2020 of $1,583, but Rentals.ca and Bullpen expect December 2020 rent to be $1,695 per month, a 5% annual increase. Given the volatility in the monthly figures, there is a wide forecast band, but rent is expected to grow at twice the rate of inflation.
14 Montreal D.png


Read
Reciprocity Logo The data relating to real estate on this website comes in part from the MLS® Reciprocity program of either the Greater Vancouver REALTORS® (GVR), the Fraser Valley Real Estate Board (FVREB) or the Chilliwack and District Real Estate Board (CADREB). Real estate listings held by participating real estate firms are marked with the MLS® logo and detailed information about the listing includes the name of the listing agent. This representation is based in whole or part on data generated by either the GVR, the FVREB or the CADREB which assumes no responsibility for its accuracy. The materials contained on this page may not be reproduced without the express written consent of either the GVR, the FVREB or the CADREB.